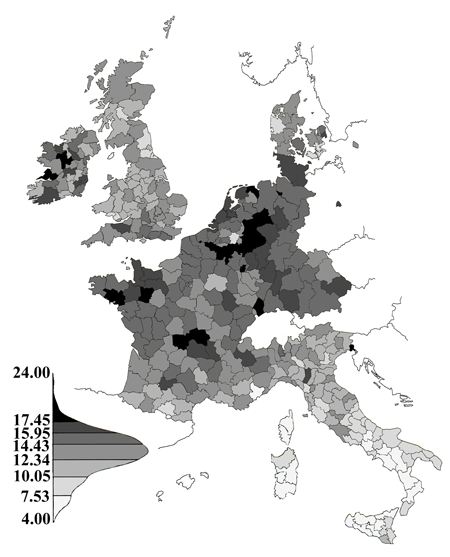
The cancer data set consists of mortality due to 40 gender-specific cancers in western Europe per 100,000 per year (age-standardized) from the years 1971-1980. It comes from the Atlas of Cancer Mortality in the European Economic Community (Smans et al. 1992) and has been analyzed in a number of publications, including (Rosenberg et al. 1999; Rosenberg 2000; Sokal et al. 1997; 2000).

A shaded map showing the spread, size, and mortality rates for the 355 cancer registration areas under study; the data represents mortality due to prostate cancer. This figure was adapted from Smans et al. (1992).
For many examples within PASSaGE, each registration area was reduced to a single point with the value represented by the mortality associated with that region.

Plot of the point locations representing the cancer registration. Each polygon was manually converted to a single latitude and longitude coordinate, either representing the center of the polygon or the largest city within the polygon. A map of Europe has been overlaid to allow easier comparison and understanding of the distribution of the points.