This tab controls the display of the plot axes. By default there are six axes: left, right, top, bottom, depth and depth top; for the vast majority of plots only the left and bottom axes will be used (it is also possible to add additional custom axes; we will describe the rare instances PASSaGE does this in the appropriate sections). For the most part, the options are identical for each type of axis.
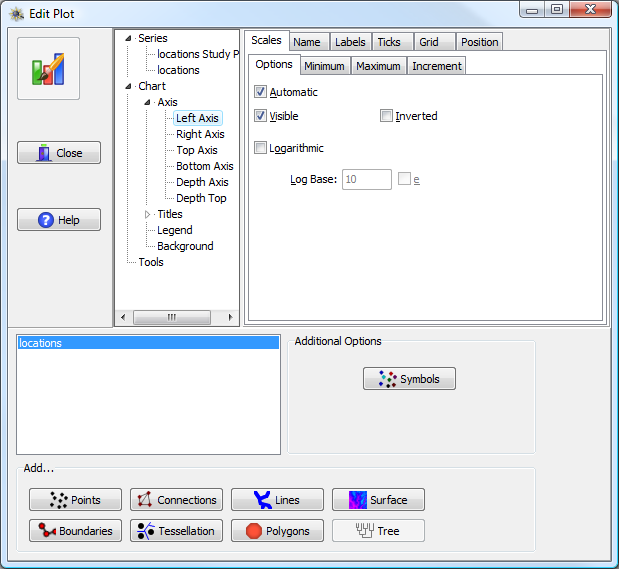
Chart Axis options, in the upper right part of the window. The specific axis to edit is chosen in the upper center (Left Axis in this example).
The axis section itself has six sub-tabs: Scales, Name, Labels, Ticks, Grid, and Position.
This tab primarily controls the scale of the axis. The minimum and maximum values may be automatically determined by the data contained within the plot or it might be specified as a specific value (PASSaGE uses both of these methods, depending on the specific circumstance). Other options include whether the axis should be visible (by default, usually only the left and bottom axes are visible), inverting the axis (going from high to low rather than low to high), or plotting the data on a logarithmic scale.
The name of the axis refers to the axis title (as opposed to the “labels” tab which controls text written next to tick marks). In addition to specifying the name, you can control the angle of the name (by default 0° for horizontal axes and 90° for vertical axes) and the format of the name, including font, background, borders, etc.
This tab controls the text labels written next to tick marks (to control the label for the axis itself, use the “Name” tab). The options are very similar to those for the axis name.
This tab controls the format of the lines making up the axis, including the primary axis line and various tick marks. Options include style, color, width, visibility. There is some control over the number and length of different types of tick marks.
This tab controls whether grid lines are displayed and their appearance. Options include style, color, width, and visibility. Grid lines are drawn at tick marks, so the grid density is dependent on the tick density. By default, there are no visible grid lines for the majority of PASSaGE plots.
This tab controls the position of the axis relative to the plot; in general these values should be left as the default, but in some cases they may be used to shift the position of one axis relative to another. In a few cases PASSaGE will automatically adjust these values to achieve a desired appearance.