Contiguous data analyses use sets of continuously made measurements as input. In one dimension this may be thought of as a transect, in two dimensions a surface, and in three dimensions a rectangular solid. It differs from point analyses and scattered data analyses by the underlying assumption that all of the data is regularly spaced and complete (although PASSaGE will allow missing values and try to work around them in the analysis).
For consistency, in this section the following notation will be used: the one-dimensional axis is x, the two dimensional axes are x and y, and the three dimensional axes are x, y, and z. The number of quadrats in each dimension are nx, ny, and nz. The recorded data value for a specific quadrat is dx, dxy, or dxyz, depending on the number of dimensions. Scale, block size, and distance will be referred to as b; the exact definition and interpretation of b varies somewhat with different methods.
Most of these methods in PASSaGE allow the input data to come from either two- or three-dimensional data matrices, regardless of the dimensionality of the analysis to be performed. PASSaGE will automatically extract data from specified directions and dimensions as appropriate.
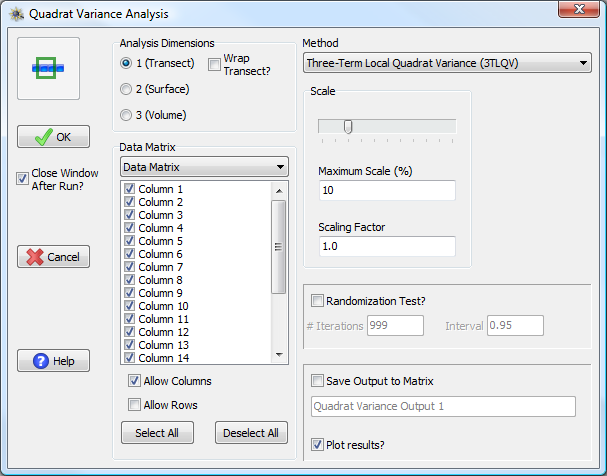
If performing a one-dimensional analysis and the input matrix is two-dimensional, one can choose to analyze transects extracted from rows or columns (or both).

Quadrat Variance Analysis window. The input data matrix is two-dimensional, but a one-dimensional analysis is specified. The user can choose to allow analysis of Columns and/or Rows using the check boxes above the Select All button. These sorts of controls are generally found for all contiguous analyses.
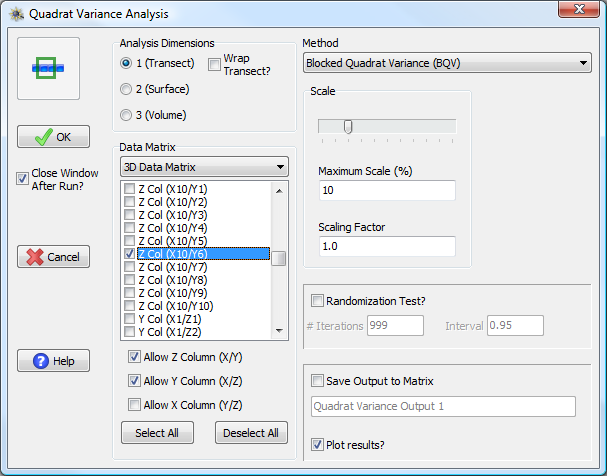
If the input data matrix is three-dimensional, one can choose a specific columns of data from the x, y, or z directions. Three-dimensional columns are specified by the coordinates held constant in the other two dimensions, thus a column along the x-axis is specified by its y- and z-coordinates.

The input data matrix is three-dimensional, but a one-dimensional analysis is specified. The user can choose to allow analysis of columns along the Z, Y, or X axes. Columns along an axis are specified by the values from the other axes which are held constant. Thus the high-lighted Z column in the figure is found by looking at all values along the Z-axis when X = 10 and Y = 5.
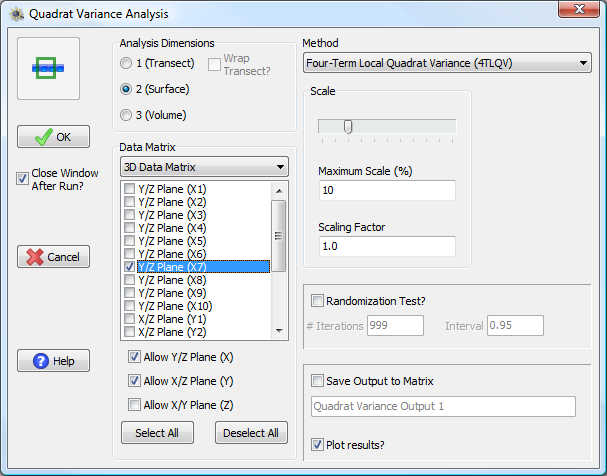
For a two-dimensional analysis, if the input matrix is two-dimensional then the entire matrix is automatically analyzed as a surface. If the input matrix is three-dimensional, then one can choose a plane (surface) sliced from the three-dimensional volume to analyze. A plane is defined by the value of the axis perpendicular to the plane which is held constant.

The input data matrix is three-dimensional, but a two-dimensional analysis is specified. The user can choose to allow analysis of a plane (surface) in the X/Y, X/Z, or Y/Z dimensions. Planes are specified by the value from the perpendicular axis which is held constant. Thus the highlighted Y/Z plane in the figure is found by looking at all combinations of values in both the Y and Z directions when X = 7.
For a three-dimensional analysis, the input matrix must be three-dimensional and the entire matrix is analyzed as a volume.