This command will display a list of all plotted elements (series) on the side of the chart window and is analogous to the "Table of Contents" in some GIS systems. As in GIS, this display is not part of the chart (i.e., it will neither save nor print); it does allow one to quickly hide or show individual plotted components. Formatting options for each series are controlled under the Format chart command, although double clicking on an item in the series list will jump to the appropriate section of the chart editor.
When Chart Window is Active
| Menu: | Draw→Chart→Show / Hide Series List |
| Button: | |
| Batch: | <none> |
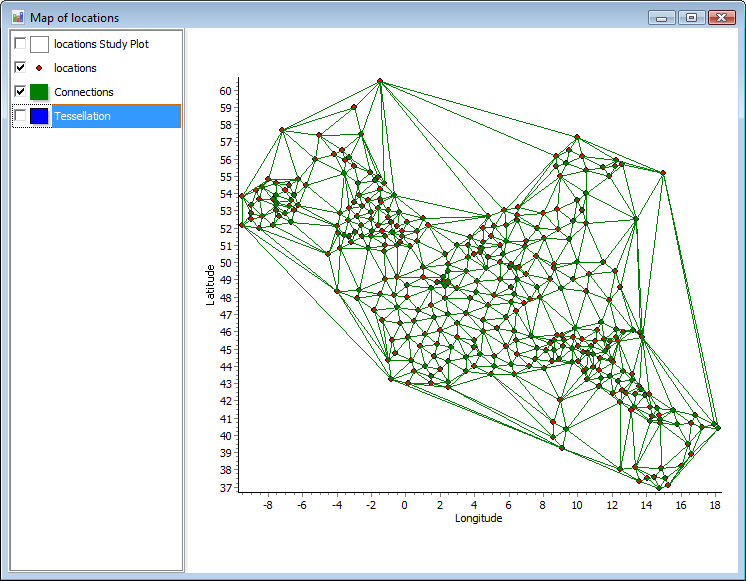
Chart window with series list showing. Only two of the four loaded elements are checked and actively being plotted.