Many analyses within PASSaGE contain options for graphing the results. The following set of procedures allows one to graph data directly, outside of a specific analysis. They can be very useful for exploring data prior to an analysis.
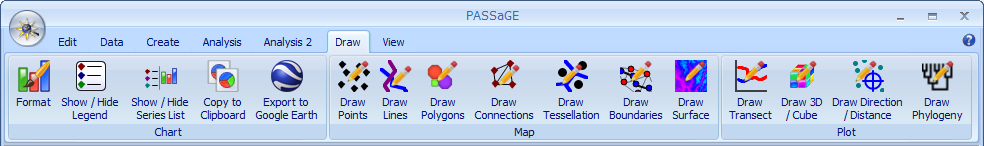
The Draw tab and toolbars.