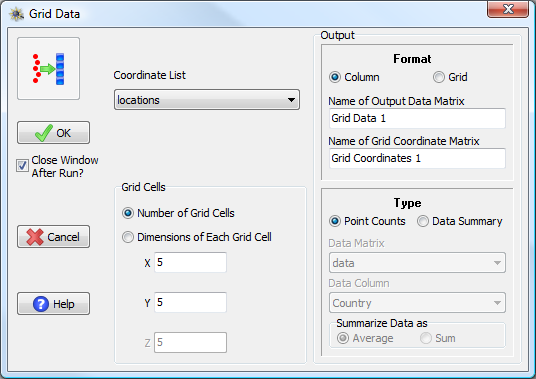
This function can be used to turn point location data (or point-located data) into a contiguous surface by summarizing the data across an overlaid grid.
| Menu: | Create→Other→Grid Data |
| Button: | |
| Batch: | GridData |
The constructed grid is automatically the same number of dimensions as the coordinate matrix. One can define the grid by either specifying the number of grid cells desired on each axis or by specifying the dimension of the grid cell along the axis.
The data can be output in two forms: in columnar output, a rectangular matrix is constructed where each row consists of a specific grid cell, the first column(s) contain the coordinates of the cell and any subsequent column(s) contain the data determined for the cell. In grid output, a rectangular (or 3D) matrix is constructed as a contiguous surface where the position within the matrix determines the coordinates and the cell contains the value associated with the cell.
The actual data determined for each cell can consist of either point counts (literally the number of points from the coordinate matrix that fall within the cell) or can represent a summary of data values associated with the points within the cell. In this case, an additional matrix representing the data associated with each coordinate as well as the appropriate column within the matrix need to be specified. The data for a cell is then summarized as either a sum or an average (mean) across all points.

The Grid Data window