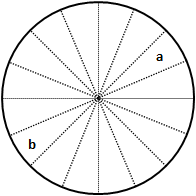
Angular wavelet analysis is a method developed by Rosenberg (2004) for analyzing anisotropy in point patterns. It makes special use of wavelet analysis to determine the direction(s) along which most of the points are found. The method works by taking one of the points in the plot (the focal point), dividing the space around it into 1° sectors, and counting how many of the other points fall within each sector. These counts are then analyzed using one-dimensional wavelet analysis with each sector representing a quadrat, but recognizing that the end sectors wrap around a circle and are actually adjacent.

Counting points in sectors around a focal point. Points in opposite sectors (a and b in the figure) are combined for a single count.

The "transect" of sector counts has 180 quadrats, one for each degree, and wraps such that quadrat 180 is adjacent to quadrat 1.
Under this scenario, the positional variance output from a wavelet analysis actually indicates directions of pattern. Peaks in this variance indicate directions where most of the other points fall relative to the focal point. Local patterns can be identified by specifying a single focal point in the analysis; for a global pattern, positional results are averaged across all possible focal points.
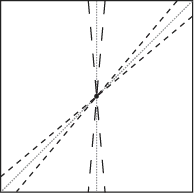
Two forms of edge correction are employed. The first form restricts focal points to those found in the center portion of the plot; without this correction, points in the corners of the study area will sometimes bias the analysis due to overweighting from the second edge correction (see Rosenberg 2004 for details). This correction only applies to global analyses; any point may be chosen for the focus in a local analysis. The second form of edge correction adjusts the sector counts to a density based on the shape of the plot since a focal point in the middle of a square plot may find more points along the diagonal directions than the perpendicular directions due simply to increased area.

Without an edge correction for area, more points may be found along the diagonal than the vertical simply because the diagonal sector encompasses greater area.
| Menu: | Analysis→Point Data→Angular Wavelets |
| Button: | |
| Batch: | AngularWavelet |

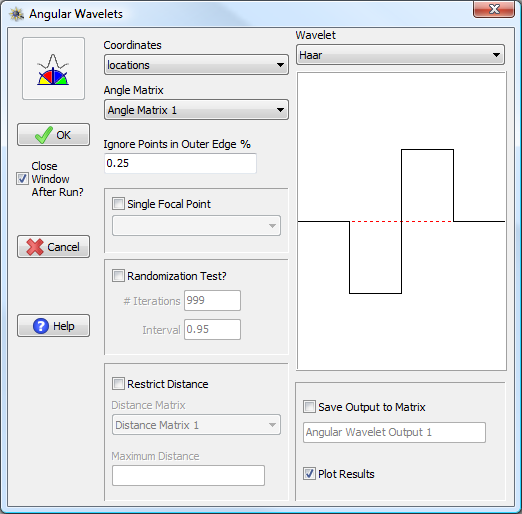
Angular Wavelet window.
To run an angular wavelet analysis, one must specify the coordinates of the points and an angle matrix for those same coordinates. For global analyses, the Ignore Points in Outer Edge % option controls to what degree focal points will be restricted to the center of the study area. To perform a local analysis, check the Single Focal Point box and then choose the specific point from the coordinate matrix you wish to use as the focal point; otherwise, a global analysis will be conducted based on the average across all valid focal points. Currently, angular wavelet analysis in PASSaGE assumes that the study area is rectangular (using the maxima and minima of observed point locations), regardless of the actual study area shape; other plot shapes will be implemented in the future.
Any of the one-dimensional wavelet kernels can be used for the analysis. These are described in detail under the general wavelet section. The randomization test works by constructing random point patterns in plots of the same size and shape as the original. If a single focal point is being used, this point is retained unchanged in the randomized plots (since its specific position is part of what is being tested); for global analyses all points are randomized. A confidence window of results is reported based on analysis of the random point patterns.
An additional option is to restrict the distance of counts. By default, all points are counted, regardless of their distance from the focal point. Using a pre-determined distance matrix, one can alternatively restrict counts out to specific distances; this would allow one to examine the scale at which anisotropy persists, not just the direction.