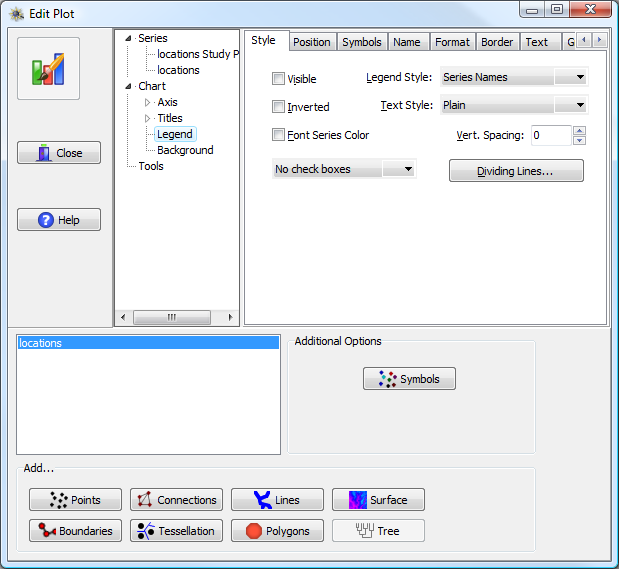
While it is possible to toggle whether the legend is visible directly from the toolbar/menu, this tab controls the specific formatting of the legend.
Chart Legend options, in the upper right part of the window.
The first three sub-tabs (Style, Position, and Symbols) are specific to legends. The Style tab controls the order of the legend elements, what the text of the legend should represent, and similar style options. The Position tab controls where the legend will be plotted and whether the chart should be resized to accommodate the legend. The Symbols tab controls whether and how symbols for the various plot elements will be draw in the legend.
The remaining tabs control standard graphical options found for many other plotted elements (such as the legend name/title, background, border, font, etc.) and will not be discussed further.
Color gradients (such as those found in surface plots) are not displayed as part of the legend. See: add a “legend” for a color gradient.