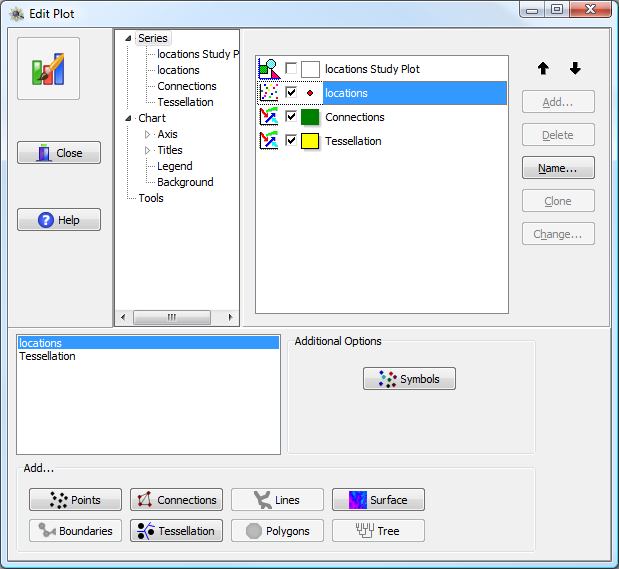
General plot options are controlled in the top half of the edit window, using the hierarchical tree view in the top center of the window. There are three primary areas: Chart, Series, and Tools, each of which may contain sub-options (which themselves may contain sub-tabs). In general, the Chart section controls global properties of the plot, while the Series section controls aspects of the plotted data. The Tools section allows the user to add specific advanced plot elements; only one of these will be discussed in detail.
The Chart section contains four primary sub-headings: Axis, Titles, Legend, and Background. A fifth heading called 3D will appear for (appropriately) three-dimensional plots. Each is described in order.
The general formatting controls are found in the center top of the screen, with three primary sections: Series, Chart, and Tools.