Map series are used to display sets of polygons. There are two primary tabs for Map series: Format and Grid3D. The Grid3D tab can be used to control the overall color scheme of the polygons; however, PASSaGE contains a more detailed color control module described under color gradients and we recommend you use this to control polygon color schemes rather than the Grid3D options.
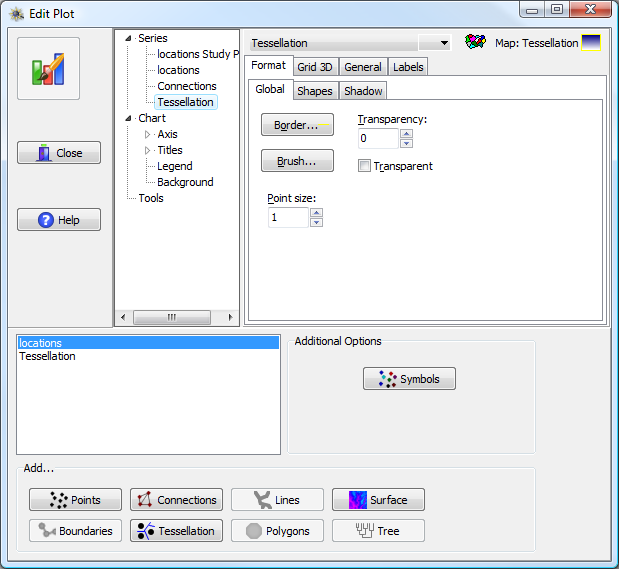
The format tab has two sub-tabs: Global and Shapes. Options on the Global sub-tab can be used to change basic properties of all of the polygons, particularly the outline color and style. In general the Brush button will have no effect, because the default values are automatically overridden by PASSaGE.
Options for Map series: The General sub-tab, upper right part of window.
The shapes sub-tab allows individual customization of every polygon. The left side of the window contains a list of all of the polygons, while the right side has formatting options which can be used to specify the appearance of each polygon individually. Border controls the outline of the individual polygon while Brush and Color combine to control the interior color. Again, these options should only be used if you want specific control over individual polygons; for global changes to polygon outline, use the Global tab, while global changes to polygon colors (when applicable) are best done with the gradient editor.
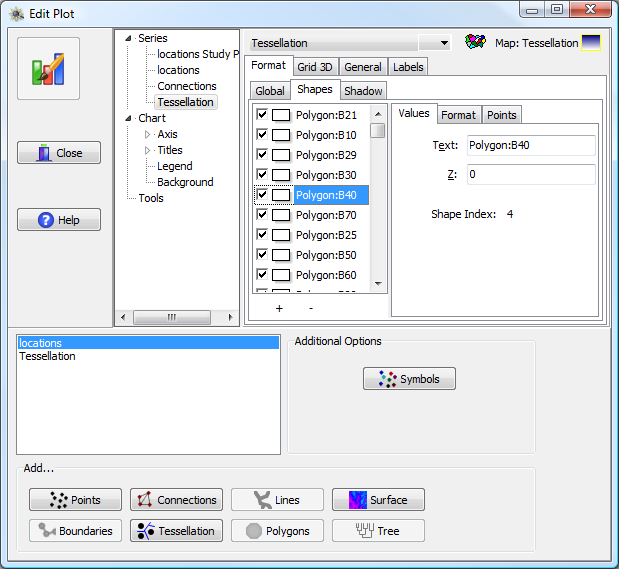
Options for Map series: The Shapes sub-tab, upper right part of window.