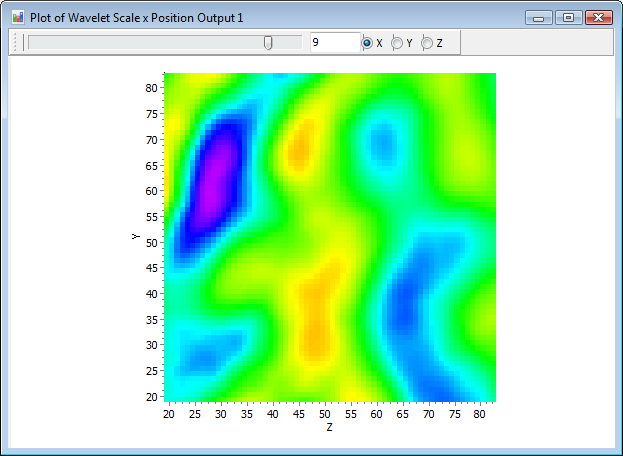
When one draws 3D data as a surface plot, a toolbar will appear at the top of the plot window. This toolbar allows you to control the axis and position along that axis where the surface will be extracted from for drawing. The axis is controlled by a trio of buttons labeled X, Y, and Z. Choosing a specific axis (e.g., X) will hold that axis constant while showing the variation in Y and Z. The position to hold X at is indicated by the number in the box in the center of the toolbar and can be controlled by changing that value or by using the slider to its left.

3D Surface Plot window with toolbar showing. In this example, we have chosen to display the surface extracted from the X axis at position 9. The surface represents the Y/Z plane for all values of X equal to 9.