The graphical system in PASSaGE allows for elaborate customization. There are a tremendous number of options, not all of which can be easily explained, but the following sections will describe the primary options. While some of the options can be confusing (we try to explain these), the use of many of them should be self-evident and we encourage trial-and-error to get the effect you wish.
When Chart Window is Active
| Menu: | Draw→Chart→Format |
| Button: | |
| Batch: | <none> |
Most plot customization is controlled through the general editing pages found in the top half of the window. For certain types of plots, additional options will be displayed in the bottom of the window.
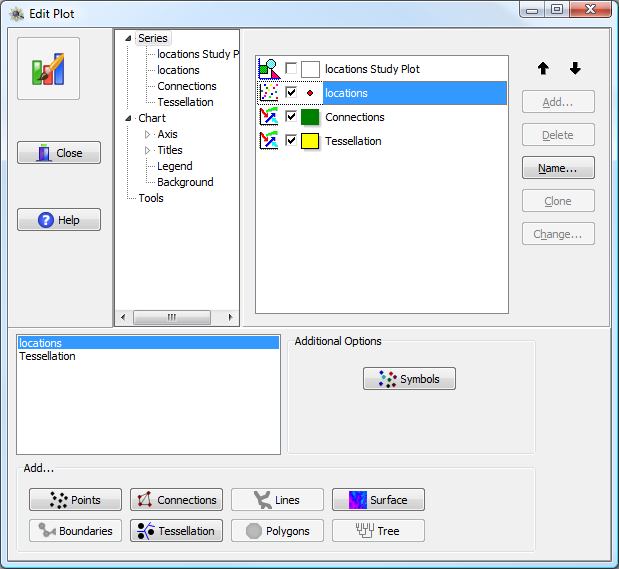
Chart editor window. The top half of the window contains general plot options; the bottom half contains additional options which may only be available (and visible) for certain types of graphs.
First, general options are discussed, followed by formatting options unique to certain types of plot elements and types of plots.