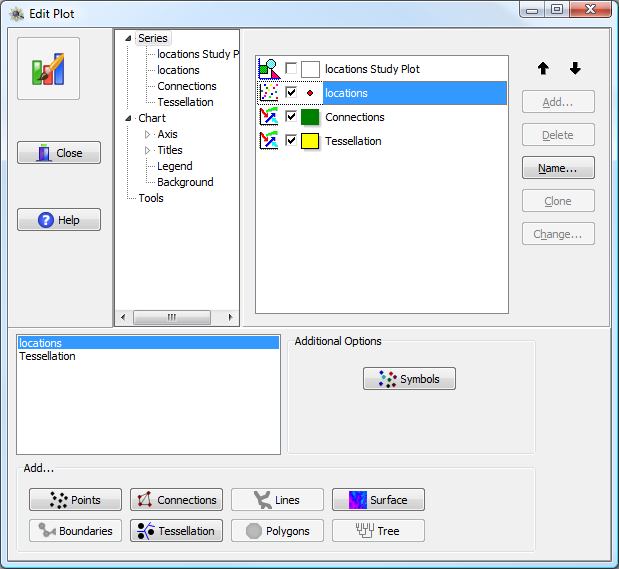
The primary Series item at the top of the tree in the Edit Plot window lists all of the plotted elements and contains a checkbox which can be used to toggle whether the element should be displayed or not. This view is functionally equivalent to displaying the list of plotted elements. Each plotted element is called a Series.
Chart Series options, displaying a list of loaded series. Checkboxes indicate those which are actively displayed.
The individual series are drawn in order, from top to bottom. Series drawn first may be hidden behind series drawn later. This tab can also be used to change the order in which series are displayed, using the arrows at the upper right hand side of the window. The name of each individual series can also be changed. This is primarily useful if you want a different name displayed in the legend.
To customize the appearance of a series, click on the name of the series in the tree list to bring up its specific formatting options.
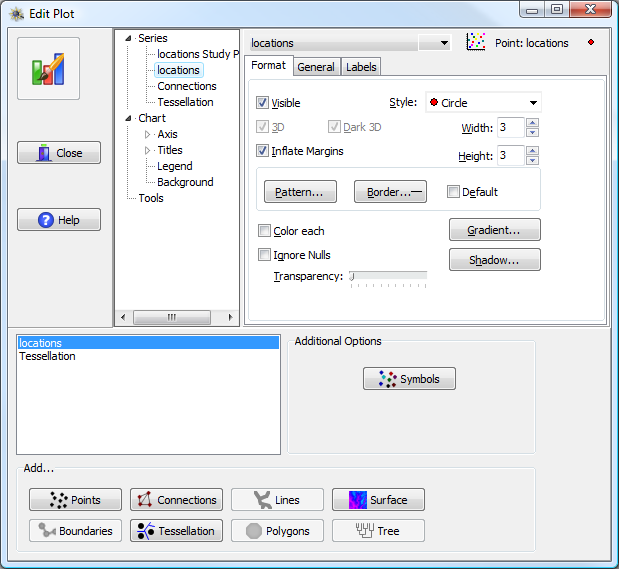
Editing the format of a specific series. The series “locations” has been chosen from the "Series" submenu. It is a point series, as indicated by the icon and label in the upper right corner of the window.
A set of options applicable to all series types are found under the General and Labels sub-tabs. The General sub-tab controls whether the series is included within the legend (if visible), the specific axes used for plotting the series (by default, almost all are attached to the bottom and left axes), and some minor formatting options. The Labels sub-tab controls whether labels are to be drawn for each individual plotted element (e.g., labeling individual points) and all of the formatting options for these labels.
The remaining formatting options for a series depend on the specific series type (e.g., 2D points, 3D points, lines, arrows, map polygons, etc.). The following sections will describe the major options for the major series types. Please read these sections carefully, because some basic options (such as color) are not always controlled in the way one would expect (for example, one cannot actually change the color of 3D point patterns by choosing a new color with the color button). Not every option is described, just those we consider to be most important.
Note: the “type” of a series can be determined by choosing the series then looking at the text description in the upper right of the window. An icon for the series type is shown first, followed by the series “type”, a colon, the series name, and (sometimes) a symbol representing the series options (e.g., point style, color etc.). For example, in the figure above the chosen series type is “Point”.