Analysis→Contiguous Data→Wavelet→Wavelets
| Menu: | Analysis→Contiguous Data→Wavelet→Wavelets |
| Button: | |
| Batch: | Wavelet |

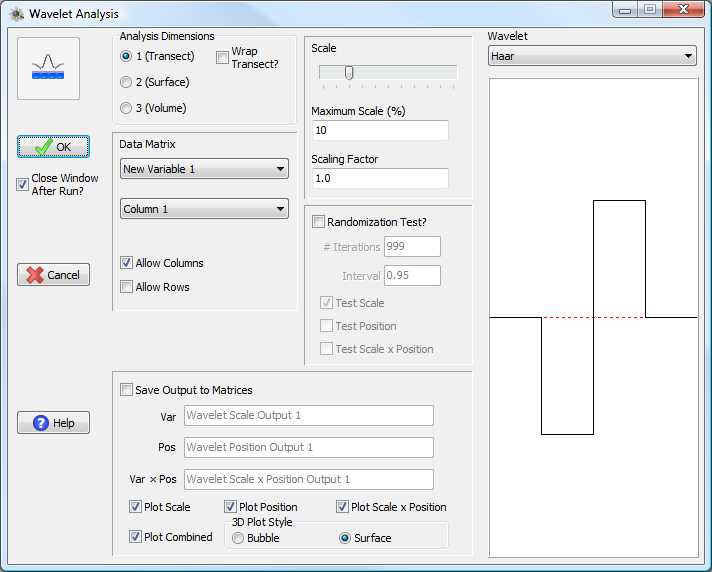
Wavelet Analysis Window
To run a wavelet variance analysis in PASSaGE, one must first specify the dimensionality of the analysis they wish to run. The specific wavelet kernels available in the drop down box in the upper right will vary depending on the dimensionality of the analysis (PASSaGE will draw a picture illustrating each kernel template below the drop down box). Like quadrat variance analysis, one-dimensional wavelets have an additional option known as Wrap Transect? If this box is checked, PASSaGE will assume that the ends of the transect meet in a circle and calculations are adjusted to account for adjacency of the endpoints. This option should be used for circular data with arbitrary endpoints (e.g., an analysis of data from a circular chromosome).
One must also specify a data matrix from which to extract data for the analysis as well as the specific data to extract. The specific options depend on the dimensionality of both the analysis and the input data. Due to the complexity of the output for wavelet analysis, only a single data set can be input each run.
Wavelet analysis is performed for all scales (block sizes) from one to a maximum specified as a percentage of the input data size. The maximum allowable scale varies by method. Generally, two-term kernels allow analysis up to 50% of the data length and three-term methods allow analysis up to 33% of the data length. More complicated kernels (e.g., Morlet wavelet) may have tighter restrictions depending on the shape of the method's template.
Although the methods are superficially similar, wavelet analysis can take quite a bit longer than quadrat variance analysis, although it also produces much more in the way of output. The dimensionality of the output depends on the dimensionality of the analysis. The scale variance (V) is always one-dimensional (this is essentially equivalent to the output from a quadrat variance analysis). The positional variance (P) has the same dimensions as the dimensionality of the input data. The scale × positional variance (W) has a dimensionality one greater than that of the positional variance (or put another way, its dimensionality is the sum of that from the scale and positional variances).
Dimensions of Analysis |
Dimensions of V |
Dimensions of P |
Dimensions of W |
1 |
1 |
1 |
2 |
2 |
1 |
2 |
3 |
3 |
1 |
3 |
4 |
The dimensionality of the output matrices from a wavelet analysis
Randomization tests for wavelet analysis work by randomizing the order of the quadrats within the transect (or surface or volume) and recalculating the wavelet profile for the randomized data. This generates a null distribution of expected variances for data with the specific observed values but with no specific geographic relationships. Significant scales of clustering can be identified from the observed data when the observed peak exceeds the expectation generated from the randomization test. One can choose whether to use the randomization test for generating null distributions around V, P, and/or W. These are tested via a single randomization procedure, but the amount of memory required varies among the different variance types because of the dimensionality differences among them (with the scale × positional variance requiring the most). The scale and positional variances are examined as one-tailed distributions, but the scale × positional variance is two-tailed.
Saving data to matrices is similar to other functions except three output matrices are produced, one for each output type (Note: PASSaGE does not save the W matrix for a three-dimensional analysis because it does not have a data type that can currently support four-dimensional data). One can also choose to independently graph each output type in its own plot (Note: no plot is produced for W in a three-dimensional analysis). A special combined plot (only available for one-dimensional analysis), draws all three graphs on a single page. For three-dimensional graphs (P from a three-dimensional analysis and W from a two-dimensional analysis; see above table) one also has the choice of producing the graph using a surface or a bubble style.
Example of Output
Wavelet analyses take longer than quadrat variance analyses, although they produce much more in the way of output…