Bivariate wavelet analysis is very similar to wavelet analysis except that it examines the covariance of two separate variables measured over the same area rather than just a single variable. Bivariate wavelet analysis is to wavelet analysis what quadrat covariance analysis is to quadrat variance analysis.
The wavelet functions and the wavelet transform is identical in both wavelet and bivariate wavelet analysis. The primary difference is that instead of calculating a W matrix for a single variable, a pair of matrices are calculated, one for each variable, W1 and W2. To get the overall covariance for a given scale, one then combines these matrices
![]() ,
,
or the average of the product of the wavelet transforms at all positions, while the overall covariance for a given position is
![]() ,
,
or the average of the product of the wavelet transforms over all scales (just as in standard wavelet analysis, two- and three-dimensional versions follow the same logic). For a standard wavelet analysis these values are based on the square of the single W; for covariate analysis it is the product of the pair of W’s.
| Menu: | Analysis→Contiguous Data→Wavelet→Bivariate Wavelets |
| Button: | |
| Batch: | BiWavelet |

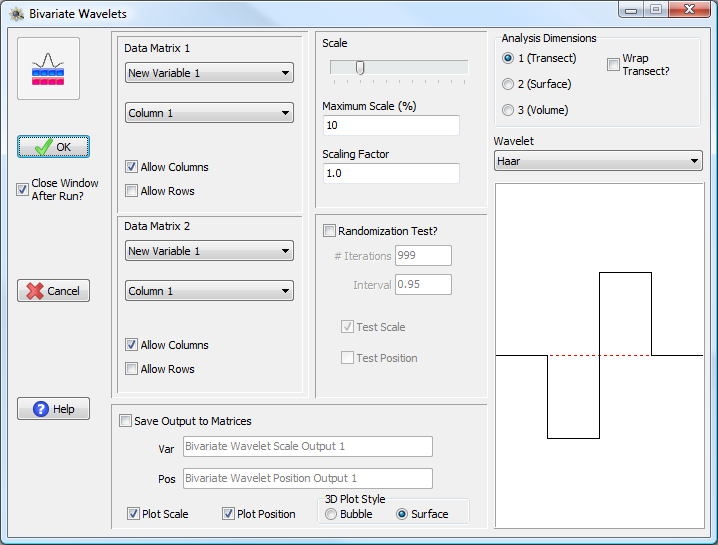
Bivariate Wavelet analysis window
Bivariate wavelet analysis in PASSaGE does not output or test the W matrices (since these can be found from a basic wavelet analysis). As with quadrat covariance analysis, the permutation test is performed by permuting the elements of both data sets in tandem. Also, the null distribution of V and P are examined as two-tailed distributions in bivariate wavelet analysis (these are one-tailed in normal wavelet analysis). Otherwise, the options for bivariate wavelet analysis are essentially identical to those of wavelet analysis.