 ,
,Variograms (also known as semivariograms) is the primary form of spatial analysis used in geostatistics (Isaaks and Srivastava 1989). It is very similar to a correlogram analysis using Geary’s c and is essentially identical to Paired Quadrat Variance analysis (Dale and Mah 1998; ver Hoef et al. 1993).
The semivariogram is calculated as
 ,
,
where yi
is the value of the variable at the ith location, n
is the number of points, wij is a weight
indicating something about the spatial relationship of points i
and j, ![]() indicates
the double sum over all i and
all j where i
≠ j, and
indicates
the double sum over all i and
all j where i
≠ j, and ![]() ,
the sum of the values in the weight matrix. Comparing this to the formula
for Geary’s c,
one quickly sees that
,
the sum of the values in the weight matrix. Comparing this to the formula
for Geary’s c,
one quickly sees that
 .
.
Geary’s c is simply a semivariogram standardized by the variance of the variable.
| Menu: | Analysis 2→Scattered Data→Variograms |
| Button: | |
| Batch: | Variogram |

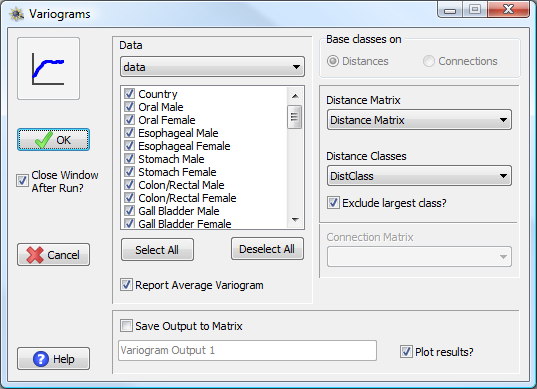
Variogram analysis window.
Explain options and give example